
Four halvings, Bitcoin climbed from $12 to $126,000 in 12 years. Bitcoin halving history reveals every cycle, every number, and why 2024 broke the pattern.
Every four years, something happens to Bitcoin that no one can stop, delay, or renegotiate. The protocol automatically cuts the block reward in half. Satoshi Nakamoto built the schedule into Bitcoin’s code in 2008, long before anyone knew whether the network would survive its first year. Today, the halving attracts global attention because many investors see it as a catalyst for the next market cycle.
The halving is Bitcoin’s most discussed event and also its most misunderstood. The dominant narrative goes like this: supply gets cut, price goes up. Buy before the halving, sell after the peak, and repeat every four years. Twelve years of Bitcoin halving history appears to support this view. Every halving has been followed by a price increase. As a result, the story almost writes itself.
The problem with that narrative is not that it’s wrong. Rather, it is incomplete. The gains from each cycle have diminished. Likewise, the timing has never been as predictable as the simplified version suggests. External conditions also varied from one cycle to the next. Finally, the 2024 halving introduced variables that no previous cycle had to contend with. Those variables may have permanently changed how halving cycles behave.
This piece is the complete record of Bitcoin halving history. It documents every halving in detail and examines what the blockchain showed before, during, and after each one. More importantly, it separates the parts of the narrative that hold up from those that do not. Finally, it offers an evidence-based view of what the 2028 halving might look like from here.
Bitcoin Halving History: What the Halving is and Why Satoshi Built it
Bitcoin’s supply is capped at 21 million coins. That cap is the feature that separates Bitcoin from government-issued currencies. No authority can create more Bitcoin. Satoshi Nakamoto wrote the issuance schedule into the protocol before the network launched, and it has never changed.
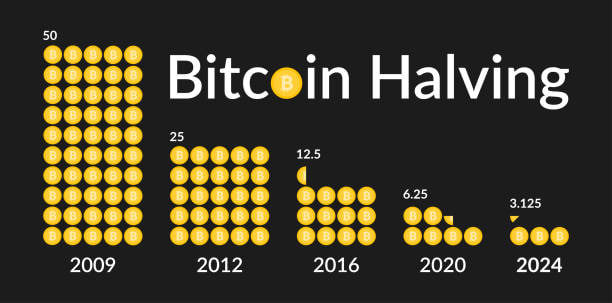
The mechanism that enforces the cap is the halving. Every 210,000 blocks, or about every four years, the protocol cuts the block reward by 50%. When Bitcoin launched in January 2009, miners earned 50 BTC for every block they produced. The first halving reduced the reward to 25 BTC, the second to 12.5 BTC, the third to 6.25 BTC, and the fourth, in April 2024, to 3.125 BTC. The process will continue until the block reward reaches zero around 2140 after about 33 halvings.
The Economics Behind the Halving
The economic logic is straightforward. As the supply of new Bitcoin falls, scarcity increases. If demand remains steady or grows, economic theory suggests the price should rise over time. Gold follows the same principle. The difference is that Bitcoin’s supply schedule is fixed. Everyone knows when the next halving will occur and how much the reward will fall. The uncertainty lies in how the market responds.
That predictability also creates an important question. If every investor knows the halving schedule years in advance, why hasn’t the market already priced it in? Under the efficient market hypothesis, it should have. Yet Bitcoin has historically appreciated after each halving. That suggests the market is responding to more than lower issuance. Investor expectations, media attention, institutional adoption, and changing demand have all influenced previous cycles.
The most reasonable conclusion is that both forces matter. The halving reduces new supply, but market psychology and demand shape how that reduction affects price. Bitcoin halving history shows that the event alone has never guaranteed a bull market, even if it has remained one of the market’s most influential catalysts.
The Four Halvings: A Complete Record
2012
First Halving — November 28, 2012
Block 210,000 · Reward: 50 BTC → 25 BTC · Bitcoin’s annual inflation rate: 25.75% → 12%
$12
PRICE ON HALVING DAY
$1,075
PRICE 12 MONTHS LATER
8,858%
12-MONTH RETURN
The first halving arrived with little ceremony. Bitcoin’s market cap on halving day was $123 million. A week later, it had risen to $130 million, a 5.7% increase that barely registered. Price accelerated months later. By April 2013, Bitcoin had climbed to $229. It then pulled back sharply to $68 before resuming its climb. By November 2013, one year after the halving, it crossed $1,000 for the first time. The 8,858% twelve-month return remains the largest in Bitcoin halving history. It is also the least likely to repeat because Bitcoin started from such a small base that the percentage gain is a poor benchmark for future cycles.
2016
Second Halving — July 9, 2016
Block 420,000 · Reward: 25 BTC → 12.5 BTC · Bitcoin’s annual inflation rate: 8.7% → 4.1%
$650
PRICE ON HALVING DAY
$19,783
Cycle peak — December 2017
2,753%
Return from halving to peak
The second halving is where the familiar halving narrative began. Bitcoin fell roughly 40% in the weeks after the halving, a detail that many articles overlook. However, the 2016 data did not support the idea that halvings cause immediate price increases. Price then moved sideways for months before beginning its climb in early 2017. The ICO boom created a surge in demand that had little to do with the halving itself. By December 2017, Bitcoin reached $19,783, a 2,753% gain from halving day. The 2018 crash erased about 85% of those gains, with Bitcoin bottoming near $3,122 in December 2018, about 17 months after the cycle peak.
2020
Third Halving — May 11, 2020
Block 630,000 · Reward: 12.5 BTC → 6.25 BTC · Bitcoin’s annual inflation rate: 3.7% → 1.8%
$8,727
PRICE ON HALVING DAY
$69,000
Cycle peak — November 2021
540%
12-month return
Bitcoin itself had crashed from $9,000 to below $4,000 in a single day in March 2020, one of its sharpest single-day declines, before recovering to $8,727 by halving day. Meanwhile, the macroeconomic backdrop was unlike anything Bitcoin had experienced in previous cycles. Central banks around the world slashed interest rates to zero or below and launched unprecedented fiscal and monetary stimulus. Governments distributed direct payments to citizens. As markets stabilized, risk appetite returned across asset classes.
Bitcoin climbed from $8,727 in May 2020 to $69,000 in November 2021. However, the rally reflected more than the halving alone. It also reflected monetary stimulus, a wave of retail investors, and the rise of DeFi and NFTs. Although the 540% twelve-month return was smaller than the 2016 cycle’s percentage gain, it produced a larger absolute dollar increase than any previous cycle.
2024
Fourth Halving — April 19, 2024
Block 840,000 · Reward: 6.25 BTC → 3.125 BTC · Bitcoin’s annual inflation rate: below 1%
$63,762
PRICE ON HALVING DAY
$126,000
CYCLE PEAK — OCTOBER 2025
~31%
RETURN AT 12-MONTH MARK
The fourth halving marked another turning point in Bitcoin halving history. Bitcoin reached a new all-time high of $73,737 before the halving, the first time in its history that it rose above the previous cycle’s peak before the supply reduction event rather than after. In February 2024, ETF inflows averaged $208 million per day, dwarfing the roughly $54 million in new Bitcoin issued each day. As a result, institutional demand absorbed more than the entire new supply before the halving even occurred.
However, the twelve-month post-halving return of 31% was the weakest in Bitcoin halving history. Bitcoin eventually reached approximately $126,000 in October 2025, about 18 months after the halving, before pulling back to around $75,000 by April 2026. As of July 2026, it trades around $75,000, roughly 40% below the October 2025 peak. Even so, the cycle showed that strong institutional demand can outweigh the direct impact of the halving itself.
Bitcoin Halving History: The Pattern That Holds and Where it Breaks
Looking across Bitcoin halving history, one pattern stands out. Every halving has been followed by a price peak that exceeded the previous cycle’s high within 12 to 18 months. That makes it four out of four across twelve years of market history. Therefore, the claim that halvings have preceded bull markets is supported by the historical data.
However, three other patterns deserve equal attention because they challenge the simpler version of that narrative.
Returns Have Diminished With Every Cycle
Bitcoin halving history shows a consistent decline in percentage returns across successive cycles. The gains reached 8,858% after the 2012 halving, 2,753% after 2016, 540% after 2020, and 31% at the twelve-month mark after the 2024 halving. Even so, the 2024 cycle eventually produced a gain of roughly 98% from the halving to its peak. This trend is consistent with a maturing asset and a much larger market capitalization. As Bitcoin’s market value grows, matching the percentage gains of earlier cycles becomes increasingly difficult. For example, a 10x move on a $123 million market capitalization requires far less capital than a 10x move on a $1.2 trillion market capitalization.
Therefore, historical returns should not be treated as a reliable guide to future performance. Many discussions of Bitcoin halving history overlook this distinction. Someone who bought Bitcoin the day before the 2012 halving and someone who bought it the day before the 2024 halving both experienced a post-halving bull market. However, the scale of their returns was dramatically different. /
8,858%
2012 cycle — 12-month return
294%
2016 cycle — 12-month return
540%
2020 cycle — 12-month return
31%
2024 cycle — 12-month return
The Halving Is Never the Only Variable
Bitcoin halving history shows that the halving has never been the only force driving each cycle. Every cycle had another major catalyst. Following the 2012 halving, Bitcoin gained wider adoption and benefited from growing demand in China. The 2017 cycle was driven by the ICO boom and the rapid growth of altcoins. During 2020 and 2021, unprecedented global monetary stimulus, institutional adoption, and demand for DeFi and NFTs all supported the rally. By 2024, spot Bitcoin ETFs had created a regulated source of institutional demand that absorbed new supply before it reached the open market.
However, isolating the halving’s contribution to each cycle remains difficult. The Economic Policy Uncertainty Index, a measure of macroeconomic uncertainty, averaged 107 in the six months after the 2012 halving, 109 after 2016, 186 after 2020, and 317 after 2024. As a result, the 2024 cycle unfolded under the most challenging macroeconomic conditions of any halving cycle. Trade tensions, geopolitical uncertainty, and the Federal Reserve’s higher-for-longer interest rate policy all weighed on market conditions. Consequently, those factors help explain why the 2024 twelve-month return was the weakest on record.
The Market Now Prices the Halving in Advance
In 2012, almost nobody paid attention to Bitcoin’s block reward schedule. The halving happened, and the market largely ignored it. Prices rose months later as new buyers entered the market. By 2024, however, institutional investors, miners, and retail traders all knew the halving date well in advance. Miners sold Bitcoin to build cash reserves before lower block rewards took effect. ETF issuers accumulated Bitcoin. Meanwhile, retail traders positioned themselves around the four-year cycle thesis.
The same principle applies to any predictable market event. When enough capital anticipates a supply reduction, some of the price impact appears before the event itself. Consequently, Bitcoin reached a new all-time high before the 2024 halving. That had never happened in any previous cycle. The outcome suggests the market had already priced in much of the expected supply shock.
“In 2012, almost nobody was watching. By 2024, everyone was. That difference in attention is itself one of the most important variables in how halvings behave.”
What the Onchain Data Shows Around Each Bitcoin Halving
Price is the most visible result of a halving cycle. However, onchain data provides a clearer picture of what happened during each one.
Miner Behavior Before and After Each Halving
Miners are the most predictable participants around each halving because their incentives are clear. They know the block reward will be cut in half, so they prepare in advance. Before each halving, onchain data consistently shows miners reducing their Bitcoin holdings to build cash reserves. Those reserves help cover operating costs after the reward reduction if revenue temporarily falls below expenses. Glassnode data showed Bitcoin held in miner-associated wallets falling to its lowest level since July 2021 before the April 2024 halving. Meanwhile, miners distributed reserves while prices remained strong.
After each halving, the pattern has remained consistent across all four cycles. Less efficient miners leave the network, causing a temporary decline in hash rate. Mining difficulty then adjusts downward, reducing production costs for the miners who remain. Over the following weeks, newer and more efficient hardware comes online, and the hash rate recovers. As a result, the network ends up with a smaller but more efficient mining base. The 2024 cycle followed the same pattern. Bitcoin’s hash rate continued to climb even though miner margins were among the tightest on record. By 2025, the network reached 1 zetahash per second, a record that showed continued investment in new mining hardware despite compressed margins.
Long-Term Holder Behavior
One of the most consistent patterns in Bitcoin halving history is the behavior of long-term holders. These are wallets that have not moved their Bitcoin for at least six months. Before each halving, long-term holder supply typically reaches a cycle peak as investors who bought during the previous bear market continue to accumulate. After the halving, prices begin to rise, market optimism increases, and long-term holders gradually start selling into demand. Consequently, this distribution phase often begins weeks or months before the cycle reaches its peak.
However, the 2024 cycle introduced a new factor. As long-term holders sold into rising prices, ETF authorized participants absorbed part of that supply for institutional clients. As a result, less Bitcoin reached the open market as direct sell pressure. This additional source of demand was absent in earlier cycles. Therefore, it may help explain why the post-peak correction in the 2024 cycle has been smaller, in percentage terms, than corrections at comparable stages of previous cycles.
The Fee Market Question
Bitcoin halving history highlights another long-term issue that receives far less attention than price movements. As block rewards decline with each halving, transaction fees are expected to replace the subsidy as miners’ main source of revenue. If fee revenue does not grow over time, miners may have less financial incentive to secure the network.
For example, the Ordinals and inscriptions boom in 2023 briefly pushed transaction fees above the block reward. Many Bitcoin supporters pointed to that period as evidence that the fee market was developing. However, the increase came from speculative demand for block space to record NFT-like data on Bitcoin rather than from widespread payment activity. Consequently, the episode showed that high fee revenue is possible, but it also showed how quickly that revenue can rise and fall with market demand.
Meanwhile, the Lightning Network routes small payments off-chain. As a result, it reduces demand for on-chain transactions instead of increasing it. This creates a long-term challenge for Bitcoin’s economic model. The technology designed to improve Bitcoin’s usefulness for payments may also reduce the fee revenue that miners need as block rewards continue to decline. Therefore, this issue becomes more important with every halving. Even so, discussions of Bitcoin halving history continue to focus far more on price performance than on the long-term economics of network security.
The 2024 Bitcoin Halving: Why It Was Different
The 2024 halving deserves its own extended analysis because it genuinely broke the historical template in ways that have long-term implications.
The most important factor was the approval of spot Bitcoin ETFs in January 2024, three months before the halving. ETF inflows averaged $208 million per day in February 2024. At the time, the entire daily Bitcoin supply was worth about $54 million for $60,000 per coin. As a result, institutional demand absorbed nearly four times the value of new daily supply before the halving even occurred. Consequently, the market entered the halving with demand that far exceeded the impact of the scheduled supply reduction.
Therefore, the halving had much less influence on short-term price formation than in previous cycles. Whether miners produced 900 Bitcoin per day or 450 Bitcoin per day mattered far less while ETFs absorbed hundreds of millions of dollars each day. Even so, the halving continued to support Bitcoin’s long-term scarcity narrative, which strengthened the investment case for many ETF buyers. However, the process that linked earlier halvings to tighter spot supply and price discovery had changed.
$208M
AVERAGE DAILY ETF INFLOWS — FEBRUARY 2024, TWO MONTHS BEFORE THE HALVING
The entire daily Bitcoin supply at $60,000 per coin was worth approximately $54 million. Institutional ETF demand was absorbing nearly four times the daily new supply before the halving even reduced that supply by half. This is the clearest illustration of why the 2024 cycle behaved differently from any previous one.
Miner economics were also more complex during the 2024 halving than in earlier cycles. For the first time, many large mining companies were publicly traded and had access to equity and debt markets. Instead of relying mainly on Bitcoin sales to cover operating costs, these companies raised capital through stock offerings, issued convertible bonds, and used derivatives to hedge price risk. As a result, miner financing became far more diversified than in previous cycles.
Meanwhile, all-in production costs for leading public miners rose to about $45,000 per Bitcoin after the halving. With Bitcoin trading above $60,000, those companies remained profitable. However, their profit margins left little room for a sharp price decline without creating financial pressure. In addition, hash price, the expected revenue per unit of hash power, fell by about 60% during the year after the halving. Even so, the network’s total hash rate continued to rise as newer mining hardware came online.
What the 2024 Cycle Debate Is Actually About
The 2024 post-halving performance has divided analysts into two camps. Understanding that debate is important because it shapes expectations for the 2028 halving.
One view argues that the cycle is still working but now produces smaller percentage gains as Bitcoin matures. Bitcoin reached about $126,000 in October 2025, roughly 18 months after the halving. That timing matches the historical pattern of peaks occurring 12 to 18 months after each halving. In addition, Bitcoin’s market dominance increased from 64% to 72% after the fourth halving. According to this view, the cycle remains intact, although the gains appear less dramatic because Bitcoin started at $63,762 instead of $12.
The other view argues that spot Bitcoin ETFs, corporate treasury buying led by Strategy, and broader institutional participation have changed how prices respond to halvings. Consequently, Bitcoin may be evolving into an asset that behaves more like digital gold. Price swings remain large, but supply-driven cycles may become less pronounced. The halving still supports Bitcoin’s long-term scarcity narrative. However, its direct effect on daily supply and short-term price discovery becomes smaller as institutional demand exceeds new issuance.
Both arguments have merit. However, Bitcoin halving history includes only four completed halving cycles. That is not enough evidence to determine whether the cycle is simply producing smaller gains or whether it has entered a new phase. Therefore, the 2028 halving will provide an important fifth data point.
Looking Toward 2028
The next chapter in Bitcoin halving history is expected to begin around April 2028. At block height 1,050,000, the block reward will fall from 3.125 BTC to 1.5625 BTC. By then, more than 94% of all Bitcoin will have been mined. Annual inflation will fall below 0.5%. As a result, newly issued Bitcoin will account for an even smaller share of the total supply, and the block reward will play a smaller role in price formation.
However, demand may have a much greater influence on the next cycle. If ETF inflows, corporate treasury adoption, and sovereign wealth fund participation continue to grow, the 2028 halving will take place in an even more institutional market than the 2024 cycle. Consequently, the supply shock will be smaller in absolute terms. Pre-halving positioning may also become more aggressive. Therefore, trading the cycle using historical patterns could become even more difficult.
The fee market will also become more important. With block rewards falling to 1.5625 BTC, transaction fees will need to provide a larger share of miner revenue over time. Whether that happens remains uncertain. Layer 2 networks, Bitcoin DeFi, and inscription-driven demand will all influence how much fee revenue the network generates.
Meanwhile, large mining companies are already preparing for the 2028 halving. They are planning hardware upgrades, securing long-term energy contracts, and refining their hedging strategies years in advance. In addition, mining has become increasingly concentrated since the 2024 halving. Foundry USA and MARA Pool now control more than 38% of global hash power. As a result, the 2028 mining industry is likely to be more concentrated and professionally managed than in any previous Bitcoin halving cycle.
What I’m Watching
Bitcoin halving history is often presented as a single narrative. However, the historical record is more complex. Understanding what happened in each cycle, including the evidence that challenges the common narrative, helps put future halvings into context.
The onchain data I watch most closely is the relationship between miner reserves and long-term holder behavior. When miners reduce their reserves while long-term holders continue to accumulate, the market has often remained well below its cycle peak. By contrast, when both groups begin distributing at the same time, the market has historically been much closer to a peak than price action alone would suggest.
For the 2028 cycle, I am watching ETF flows more closely than any other variable. The 2024 cycle showed that institutional demand could absorb much of the new Bitcoin supply before the halving. If ETF inflows remain strong, the halving’s direct effect on price could become even smaller. However, if ETF demand weakens because of macroeconomic conditions, regulatory changes, or portfolio rebalancing, the supply reduction may play a larger role again.
The halving is not a price prediction tool. Instead, it is a monetary policy mechanism built into Bitcoin’s protocol to control supply over time. Understanding that distinction matters because market prices respond to many forces beyond the halving itself.
Bitcoin halving history now spans twelve years and four completed halvings. The next halving is expected in about 21 months. Until then, onchain data is likely to provide a more reliable guide than any four-year cycle chart alone.
Takeaways from this article:
What Bitcoin Halving History Shows
Every halving has been followed by a new all-time high within 12 to 18 months. That makes it four out of four across twelve years of Bitcoin halving history. Therefore, the historical record supports the halving narrative. However, this pattern is frequently presented without the broader market context.
Returns have declined with every cycle. Bitcoin gained 8,858% after the 2012 halving, 2,753% from the 2016 halving to its peak, 540% in the twelve months after the 2020 halving, and about 31% in the first twelve months after the 2024 halving. This trend is consistent with a maturing asset and a larger market capitalization.
The halving has never been the only driver of a cycle. Each cycle had another major catalyst. The 2013 rally coincided with growing adoption in China. The 2017 cycle was driven by the ICO boom. The 2020 cycle benefited from global monetary stimulus. The 2024 cycle was supported by strong ETF demand. Consequently, evaluating the halving’s role requires considering these additional factors.
Looking Ahead
The 2024 cycle departed from previous patterns. Bitcoin reached a new all-time high before the halving for the first time. In addition, ETF inflows averaged about $208 million per day, while new daily Bitcoin issuance was worth roughly $54 million. As a result, institutional demand absorbed far more Bitcoin than miners were producing before the halving.
The fee market becomes more important with every halving. As block rewards continue to decline, transaction fees will need to account for a larger share of miner revenue. However, that transition has not yet been demonstrated on a sustained basis.
The fifth halving is expected around April 2028. The question is no longer whether the historical pattern repeats. Instead, it is whether institutional demand has permanently changed how supply reductions influence Bitcoin’s price.
Sources & Further Reading
- Bitcoin Halving History 2026: How Each Cycle Affected Price — Coingo
- Halving Price History — CoinGecko Research
- Bitcoin Halving Explained: History, Impact, and 2024 Predictions — VanEck
- 2024 Bitcoin Halving: One Year Later — Fidelity Digital Assets
- 2024 Halving: This Time It’s Actually Different — Grayscale Research
- Post Halving: Bitcoin Miners Landscape — AMINA Bank
- Bitcoin Mining Post-Halving Economics 2026: What Permanently Changed — VaaSBlock
- Five Reasons the 2024 Bitcoin Halving Is Different — CME Group
- Bitcoin Halving Price Developments — Bitcoin Suisse
- Bitcoin Halving Dates: Full Schedule to 2028 and Beyond — UseTheBitcoin
- The History of Bitcoin Halving — Kraken